
You have described your preferred future and you have broken down your dream into high level strategic goals. You have determined that you have the capacity to achieve your goals and you are ready to develop tactical objectives to move your organization into action. But how will you know if you actually get to your preferred future position?
Let’s say, for example, that you have decided that within five years you will become the “employer of choice” for your industry in your area. You have further defined what that means by stating that you will have the lowest employee turnover rate, the highest employee satisfaction scores, and the best wage and benefit packages among all your competitors. Before you start drafting tactical plans to accomplish these goals, it is necessary to quantify performance so you can set concrete targets and also monitor progress. In this obvious example, two things are required. First, you need to identify metrics that are commonly used in your field so you can compare yourself with others. Second, you have to set target goals and develop monitoring and reporting systems to track your performance over time and your progress toward actually achieving those goals. Every time you develop a new tactic or strategy to “bend the curve” or “move the needle” so to speak, you should be able to measure its impact on attaining the goal in question.
Take another example from higher education. You have decided that you are going to be the highest rated regional private college in your geographic region. To determine what that would look like, you have decided that you will use the U.S. News and World Report rankings of colleges and universities. These rankings are determined from a dozen different indicators including things like entering Freshman ACT scores, alumni giving, number of students graduating in four years, student to faculty ratios, and numerous others. You can craft a strategic goal statement with an associated metric which establishes a concrete target for any or all of those indicators. Initiatives or tactical plans can be measured for their effectiveness by monitoring the impact such actions have on the performance indicator. If you are successful at improving these metrics through careful planning and execution of strategies, there should be no reason why your institution can’t rise to the top of the charts.
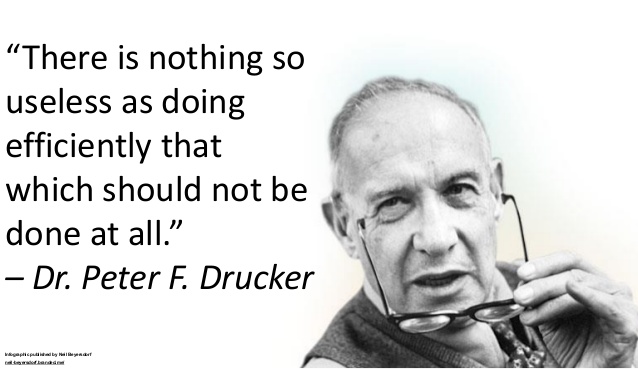 Now, I should pause here to say that what I am suggesting is considerably different than routine measurement of efficiency. You should see, for example, that measures of efficiency (e.g., faculty/student ratios) might run counter to a strategic goal. It saves money to increase faculty/student ratios but improved quality and higher learning outcomes might be enhanced by lowering the ratio. While there are certainly other factors that contribute to learning, it has been generally accepted that smaller teacher/student ratios improve learning. Hence, U.S. News and World Report’s years-long use of this metric. This distinction is very important as boards may question certain resource allocations, especially when they are aimed at improving quality indicators that may be difficult to measure.
While setting quantified target goals is important, let me also emphasize how essential it is to have systems in place to monitor on-going progress. Such systems are different than the routine monitoring of key performance indicators such as net budget variance and other descriptive statistics like people served, number of employees, etc. Business intelligence requires another level of observation and analysis. It requires tracking performance over time along with the capacity to project possible statistical scenarios  into the future. This sounds complicated, but it is really quite simple. Take one of the statistics I mentioned above such as the rate of employee turnover. Looking back over 20 or 30 quarters to get a clear picture of past performance will give you an idea of the ups and downs of the rate over time. Identifying events or environmental conditions such as the recession beginning in the third quarter of 2008 will help you to flag events which directly influenced your organization’s performance. Your environment scan in which you did your best to identify trends for the future, as well as your current status, should give you a sense of the kinds of events that might affect your ability to achieve your goals. Furthermore, the thorough capacity assessment you conducted will give you a good sense of the extent to which you can “bend the curve.”
So, considering where you would like the organization to be in three to five years, it is possible to map several possible scenarios that meet or exceed that goal. As data gets updated each quarter, it is possible to refine the path to success by evaluating those actions, conditions, or strategies that have an impact on performance, and to enhance, alter, or cease those actions as needed.
It is also possible to contemplate conditions or possible events that might lead you to fall short of your goal. While not a desired scenario, recognizing the factors that might bring it about is helpful in developing strategies to avoid failure. Such possibilities should be part of an overall risk management system and is a subject for another time. Predicting performance based on past performance, understanding current realities and future trends, and tracking real-time data to identify trends allows you to be nimble and responsive to changes in your environment.
But then, that’s the subject of next week’s article, “How will you address challenges and opportunities along the way?” Stay tuned.
As always, your thoughts and reactions are most welcome.